1
2
3
4
5
6
7
8
9
10
11
12
13
14
15
16
17
18
19
20
21
22
23
24
25
26
27
28
29
30
31
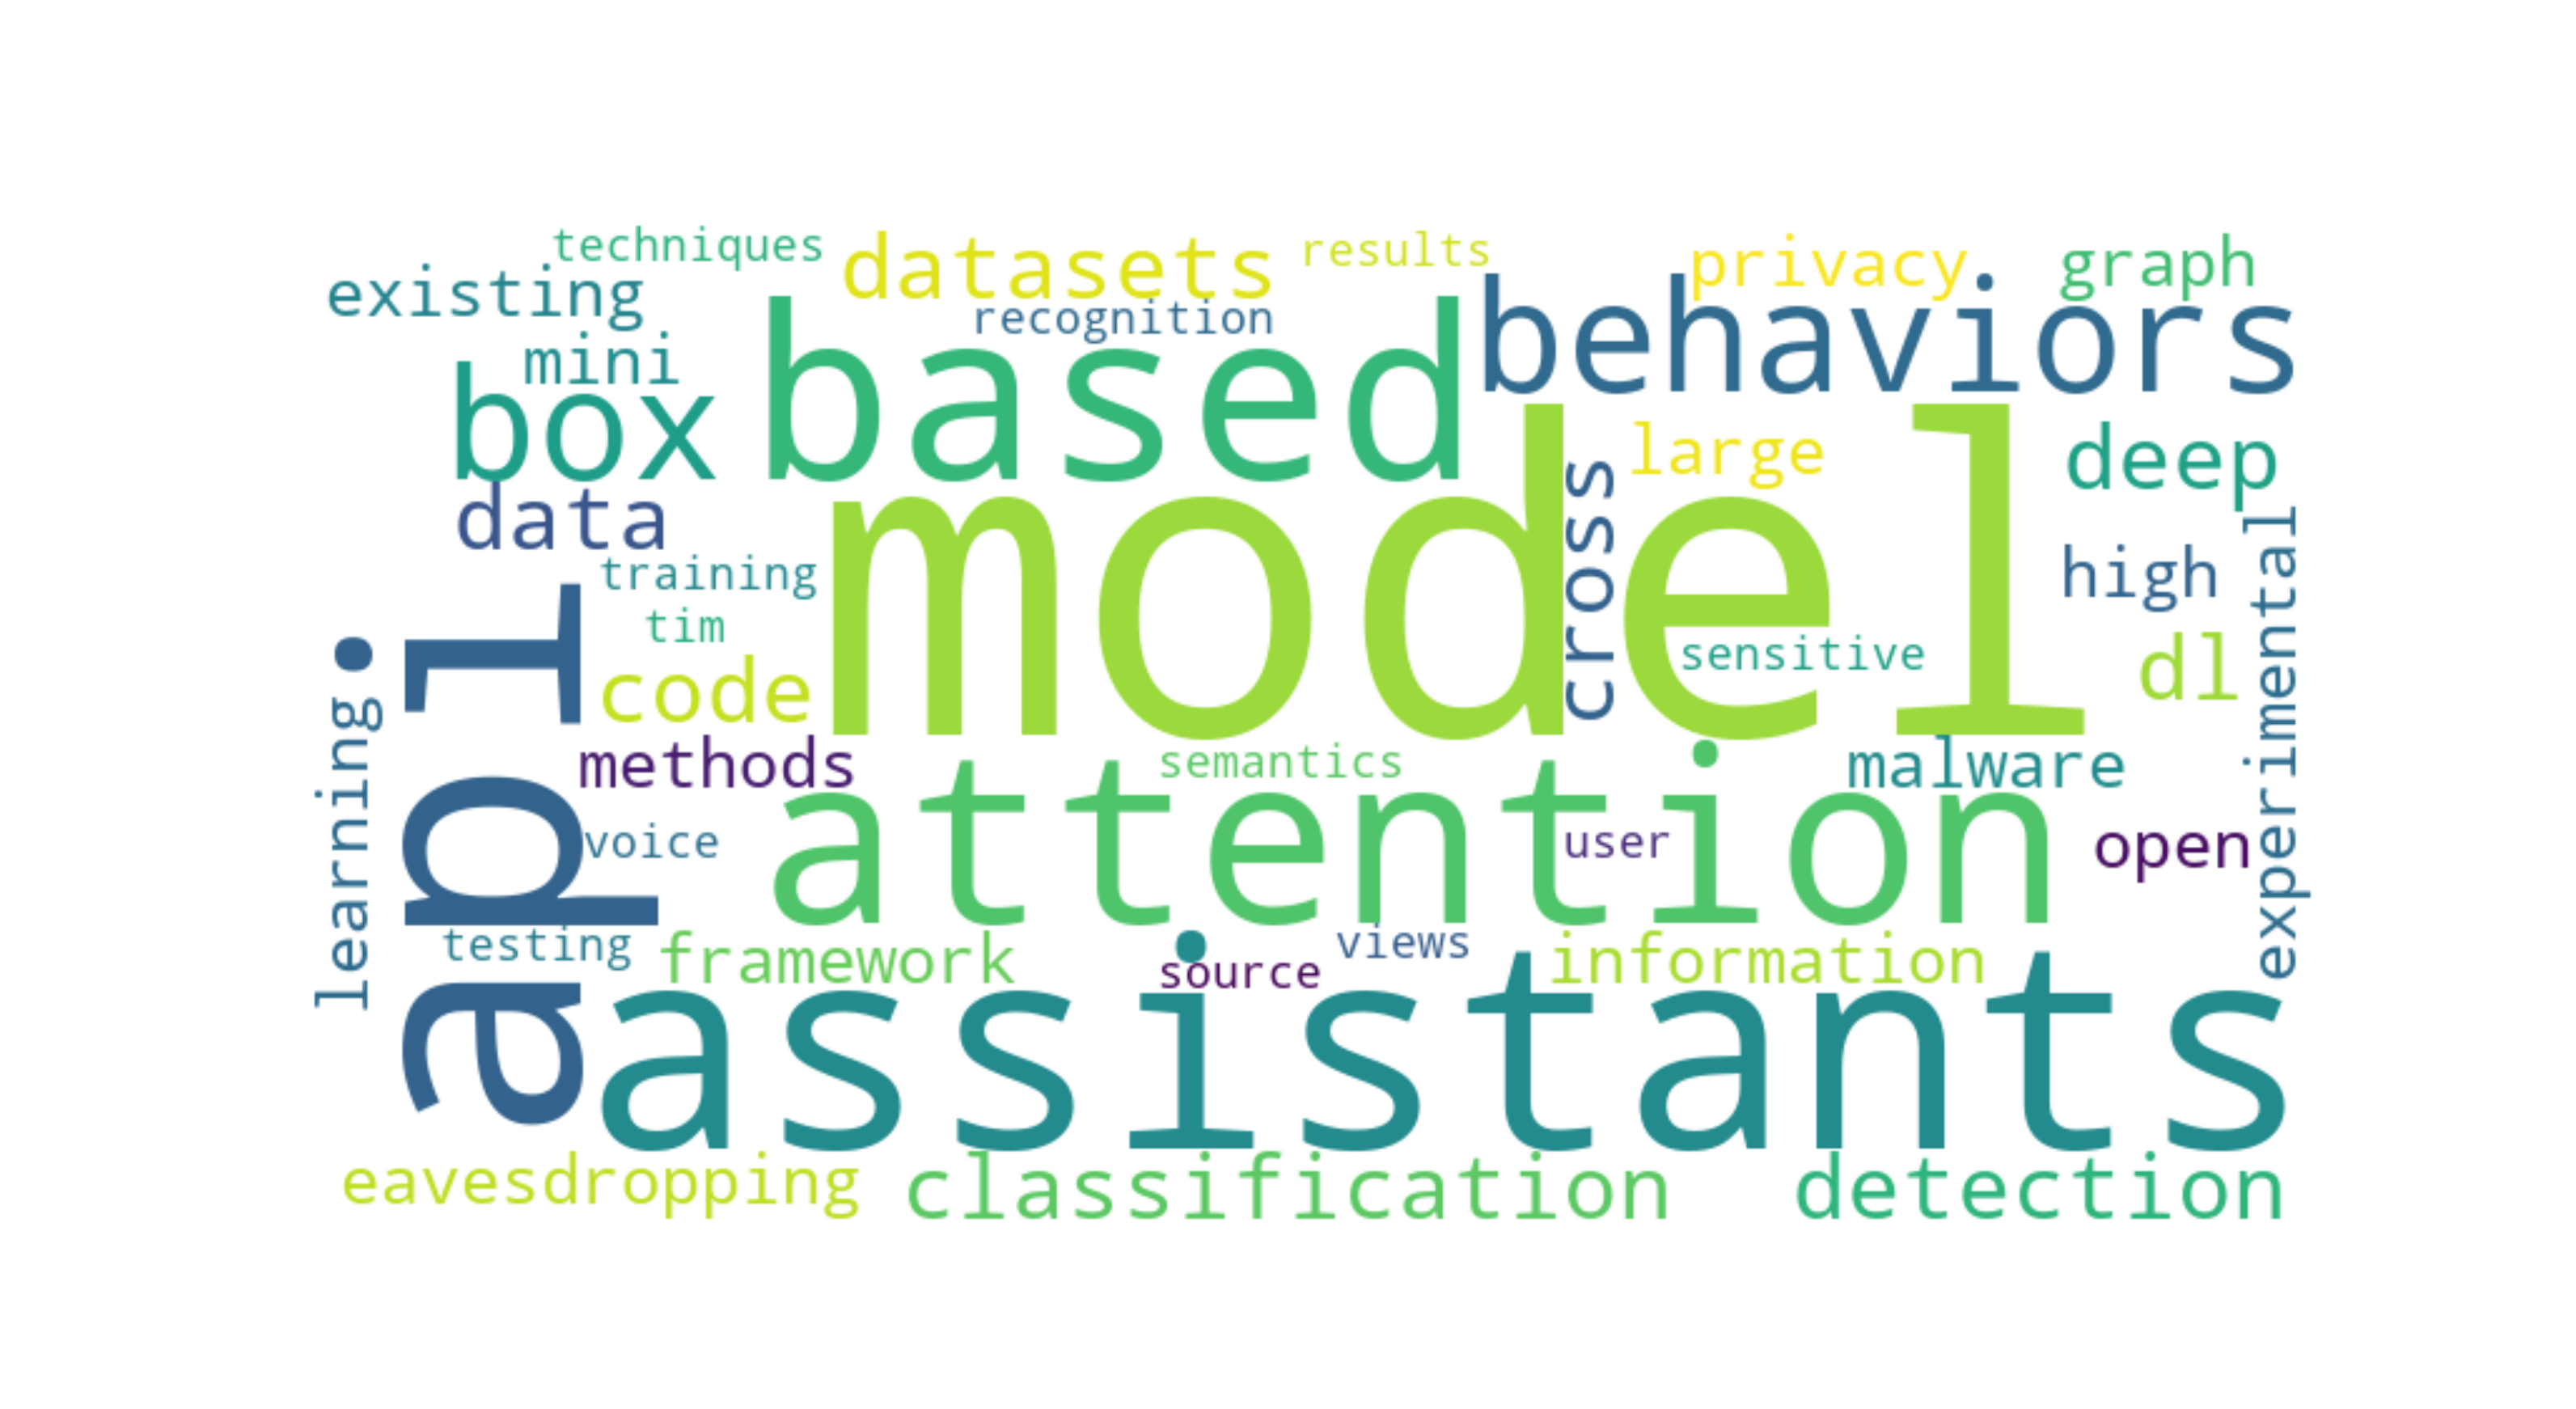
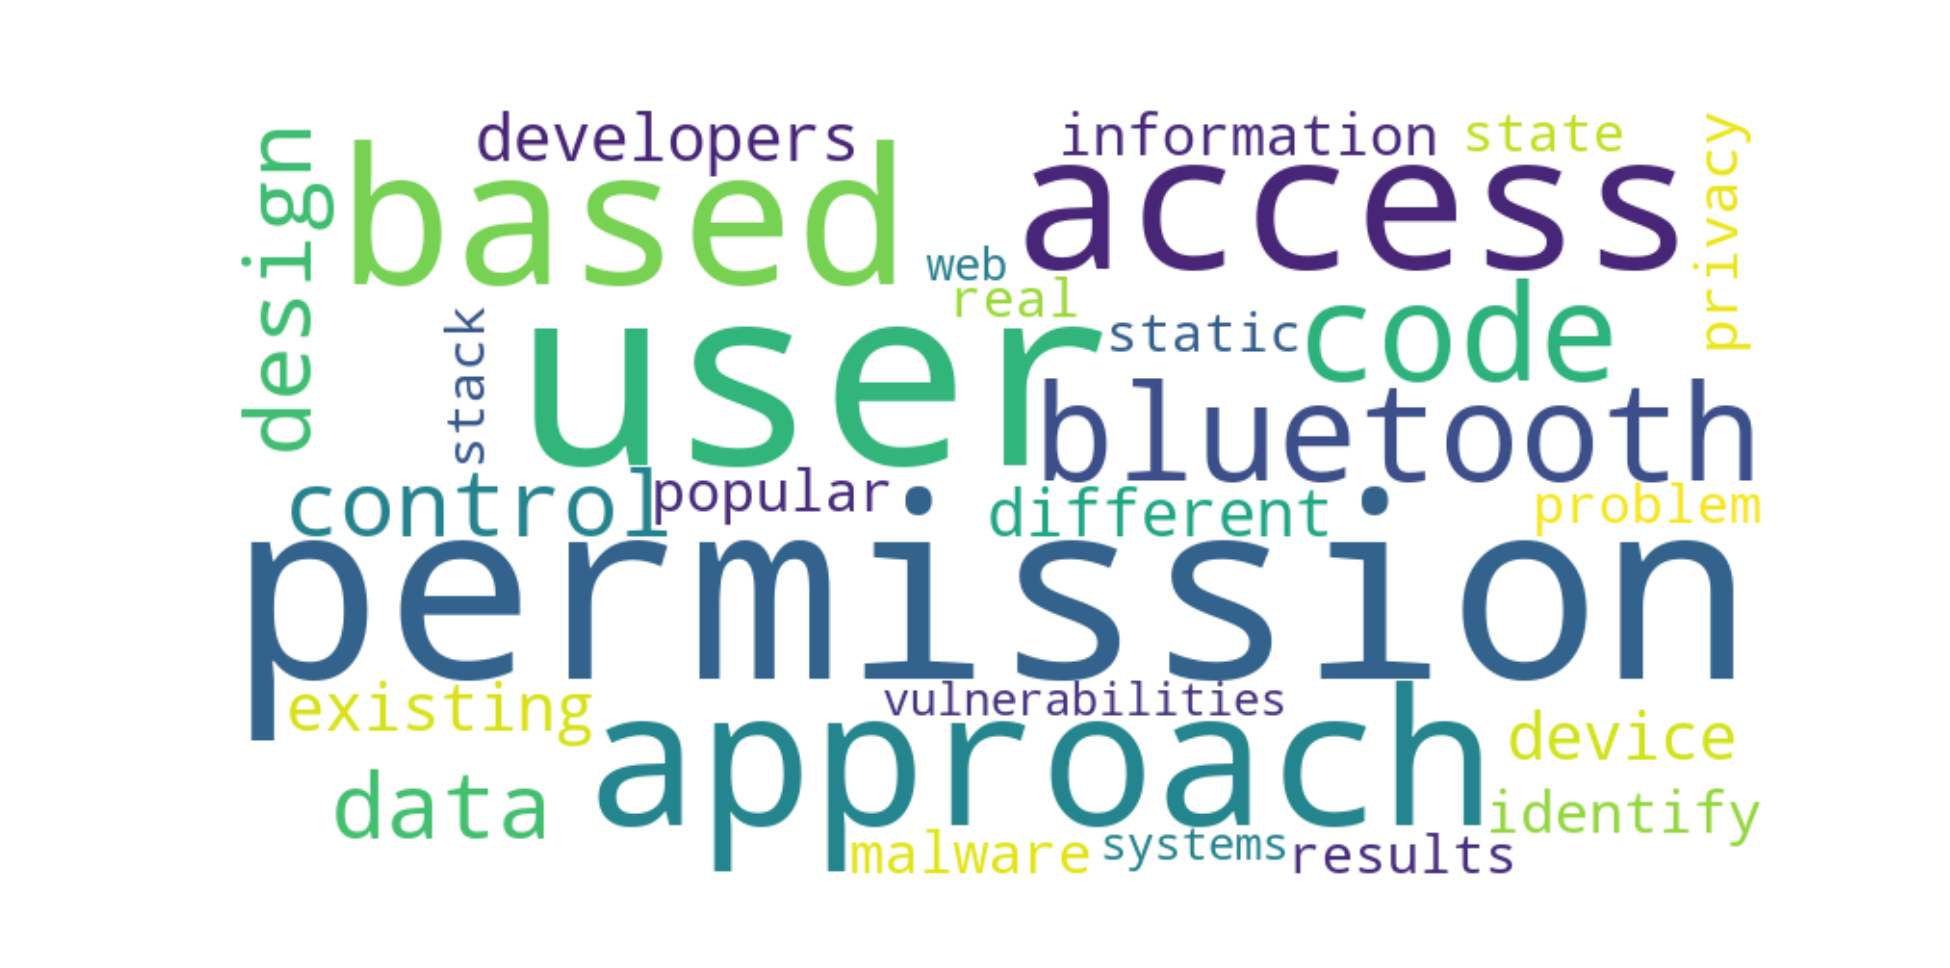
| import pandas as pd
from sklearn.feature_extraction.text import TfidfVectorizer
import matplotlib.pyplot as plt
from wordcloud import WordCloud
df = pd.read_excel("S&P.xlsx")
texts = df["论文名称"] + " " + df["Abstract"]
custom_stop_words = set([
"app","apps","application","attack","mobile","applications","devices","android","research","paper","google","software","analysis",
"study","security","attacks","used","use","using","new","accuracy"
])
vectorizer = TfidfVectorizer(stop_words="english", max_features=50)
tfidf_matrix = vectorizer.fit_transform(texts)
filtered_keywords = [word for word in vectorizer.get_feature_names_out() if word not in custom_stop_words]
wordcloud = WordCloud(width=800, height=400, background_color="white").generate(" ".join(filtered_keywords))
plt.figure(figsize=(10, 5))
plt.imshow(wordcloud, interpolation="bilinear")
plt.axis("off")
plt.show()
|

